Radar from NOAA, every 2 minutesForecast seven models, side by sideSatellite day and nightStatus private beta

Radar · forecasts · snow

A clear weather map, built on public data.

wxdeck started as a personal project: one map with the radar, the satellite and a few forecast models side by side, with nothing in the way. It is in private beta and free to use while it is being finished.

No card and no password. Sign in with your Google account.

wxdeck: radar, warnings and the timeline over southern Arizona
Storms south of Tucson, Arizona, on an October afternoon.

What's on the map

01 · RADAR

Radar that updates every two minutes.

The radar comes from NOAA and refreshes every two minutes. You can scrub back through the day or ahead into the forecast on the same timeline, and warnings are drawn on the map where they apply.
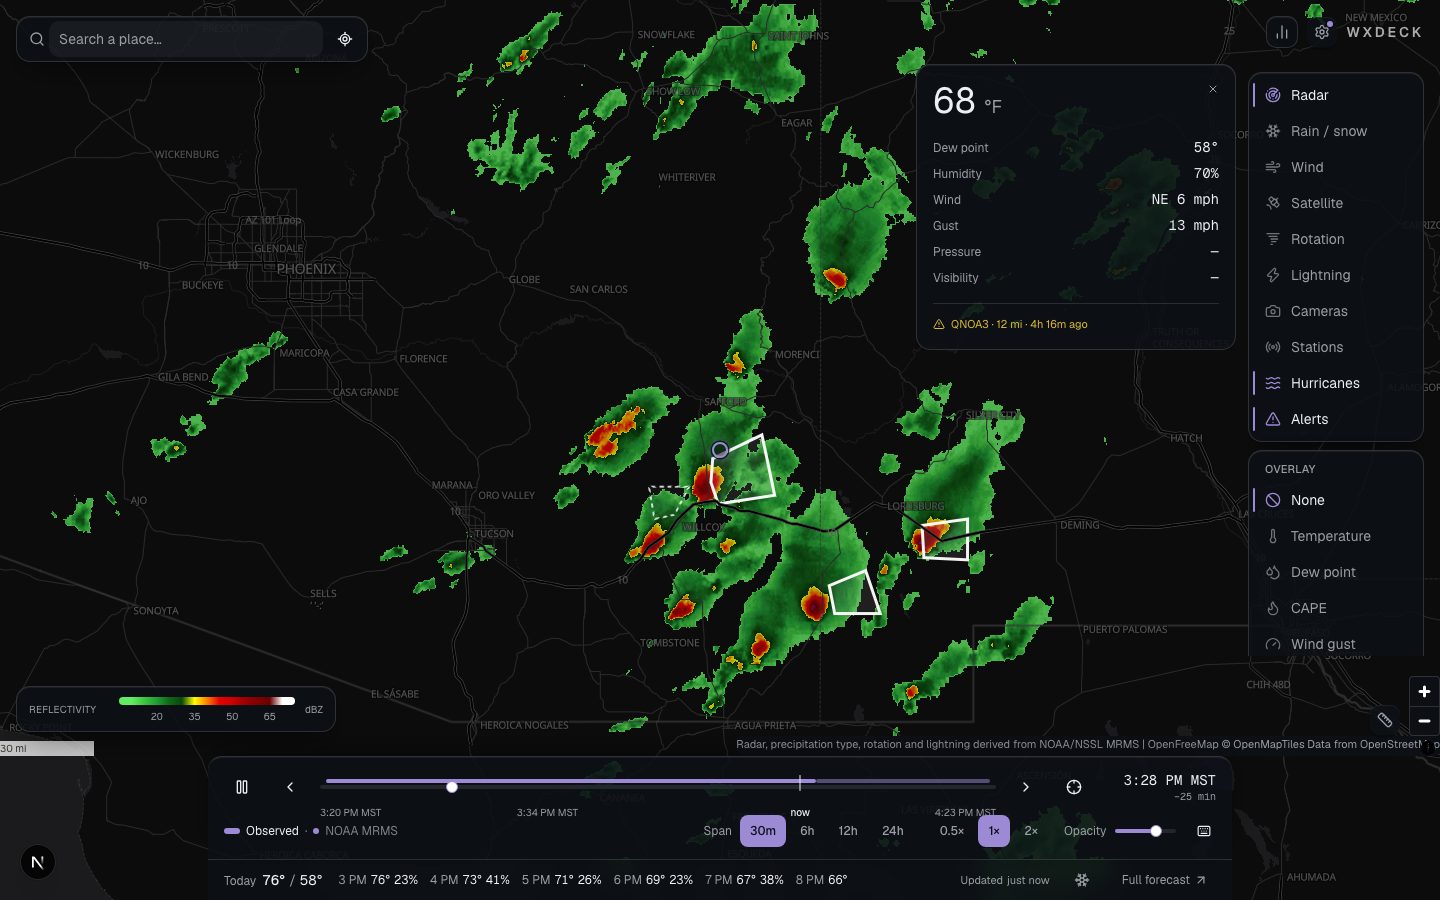
wxdeck radar over southern Arizona with severe thunderstorm warning polygons
Storms south of Tucson, Arizona, on an October afternoon.

02 · OVERLAYS

Temperature, pressure, clouds, snow and more.

Each overlay moves with the timeline, so you can watch a front come through or a snow line drop instead of guessing from a single map. The legend always matches what is drawn.
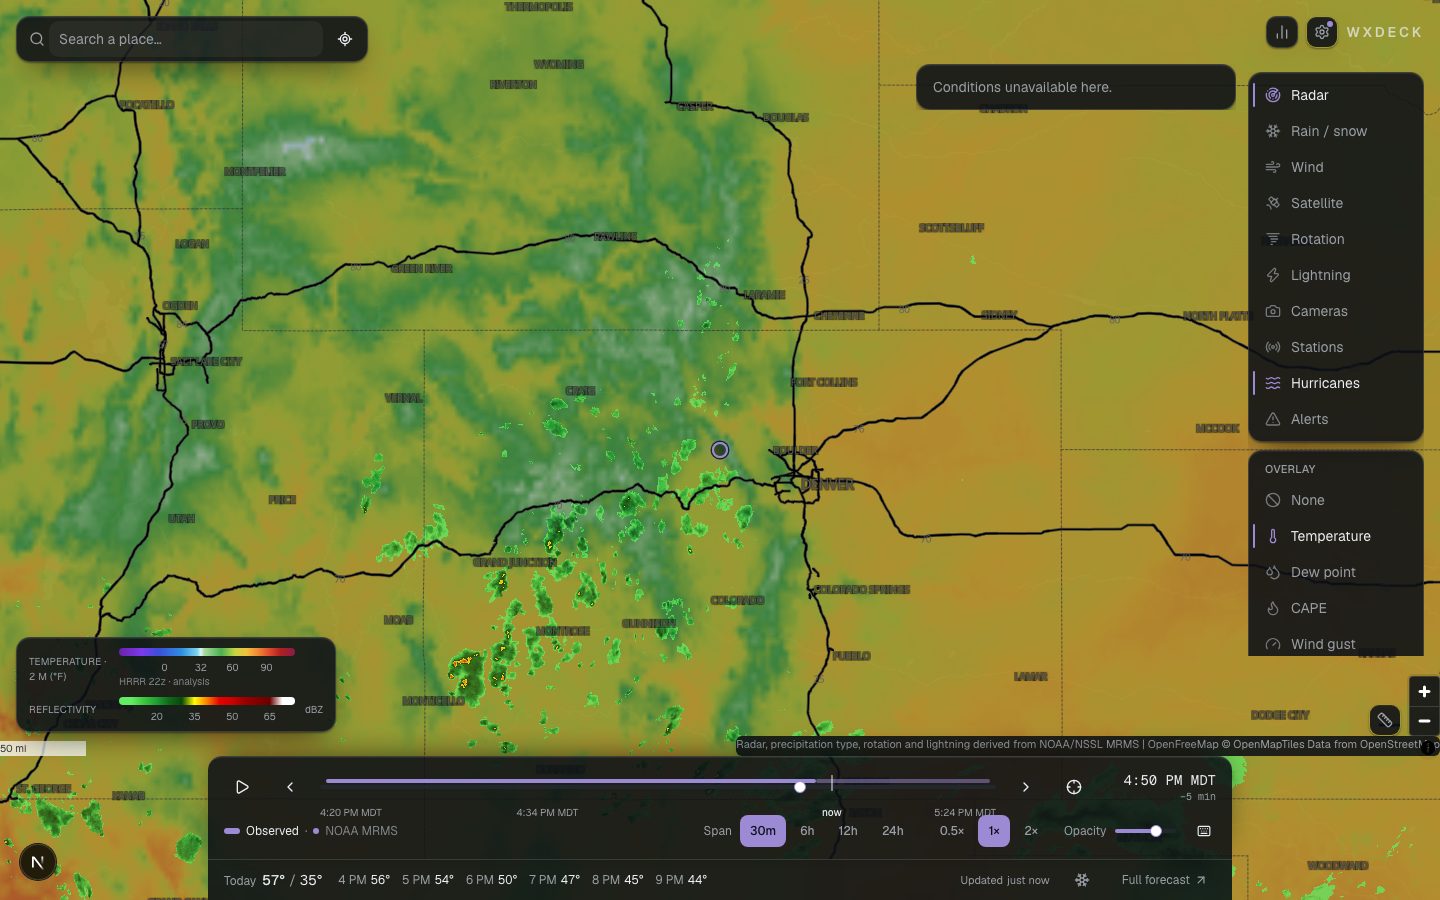
Temperature overlay across the Rockies with the timeline below
Temperature over Colorado and Utah.

03 · WIND

Wind at the surface and at altitude.

Wind is animated, so you can see where it is going rather than read arrows. You can step up through nine altitudes, which is useful in the mountains and on the water.
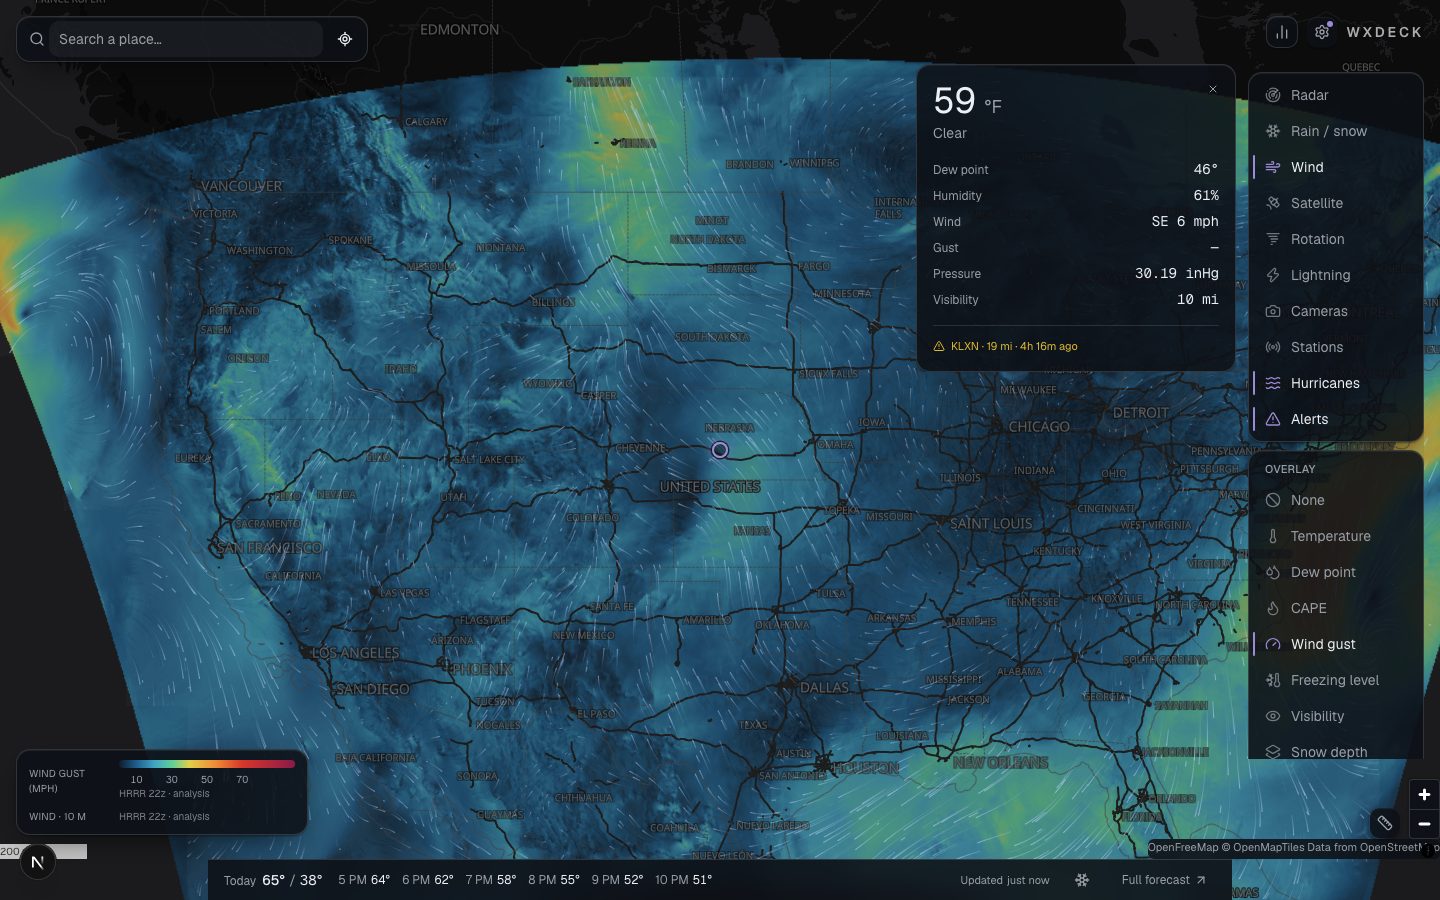
Wind particles over the central United States
Surface wind across the central United States.

04 · SATELLITE

Satellite underneath the radar.

Satellite imagery sits under the radar on the same timeline, in colour during the day and infrared at night.
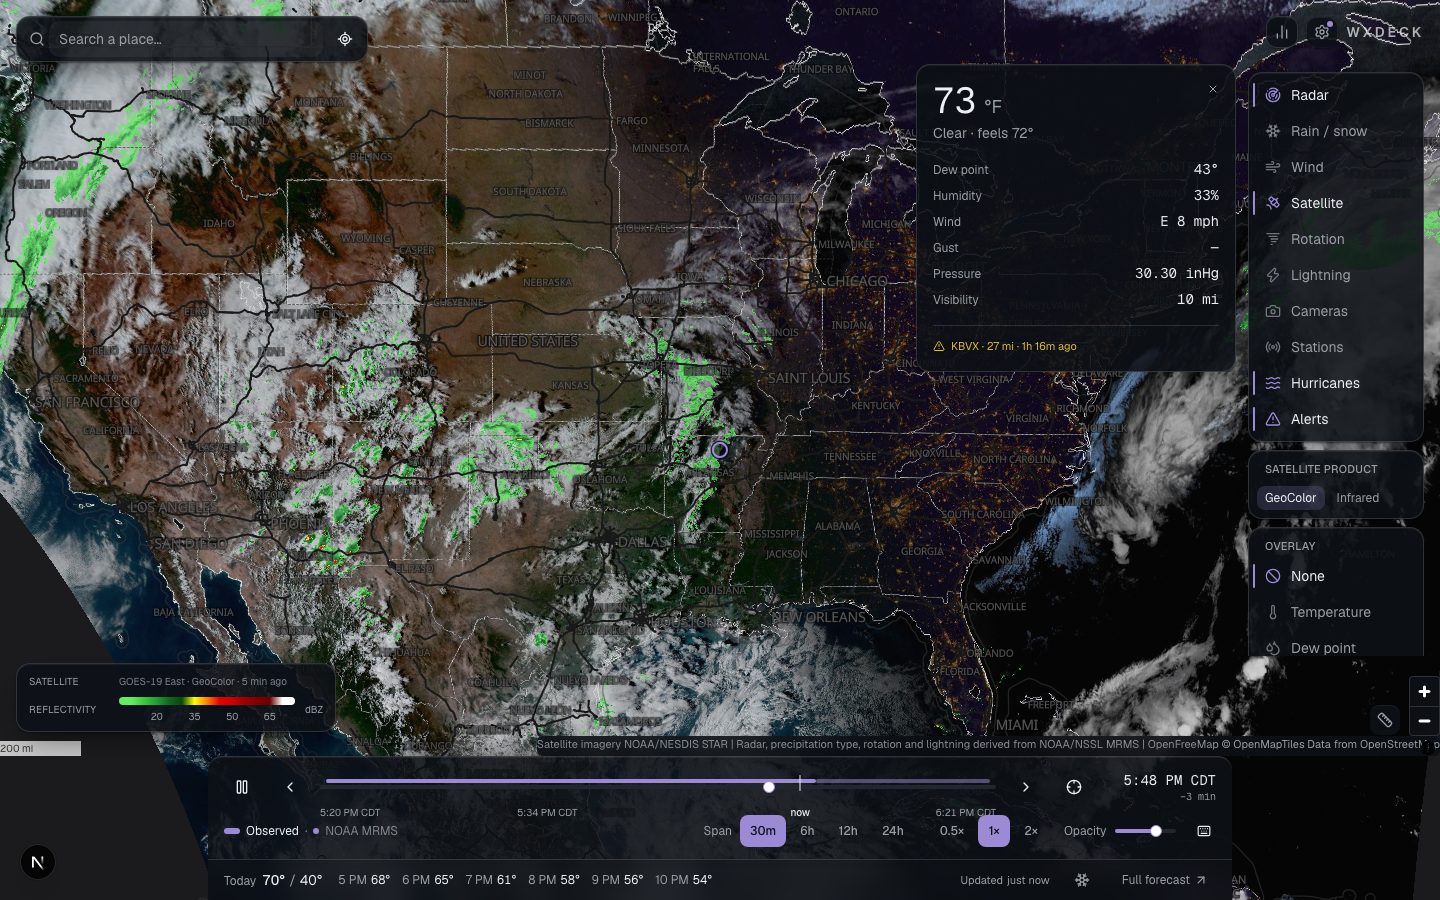
GOES satellite imagery beneath radar over the southeastern United States
Satellite and radar over the Southeast.

Winter

Snow

How much snow, not how much water

Most forecasts assume ten inches of snow for every inch of water. That is often wrong. wxdeck works out the ratio from the temperature through the air column, hour by hour, and shows what each model thinks.

What actually fell

Snowfall over the last one, two and three days, on the map, from the same analysis the forecast offices use. Also snow depth, the freezing level, and whether the radar is seeing rain or snow.

Coming this winter

Mountain snow stations on the map, a better snow level, and an alert when a place you have saved is about to get snow.
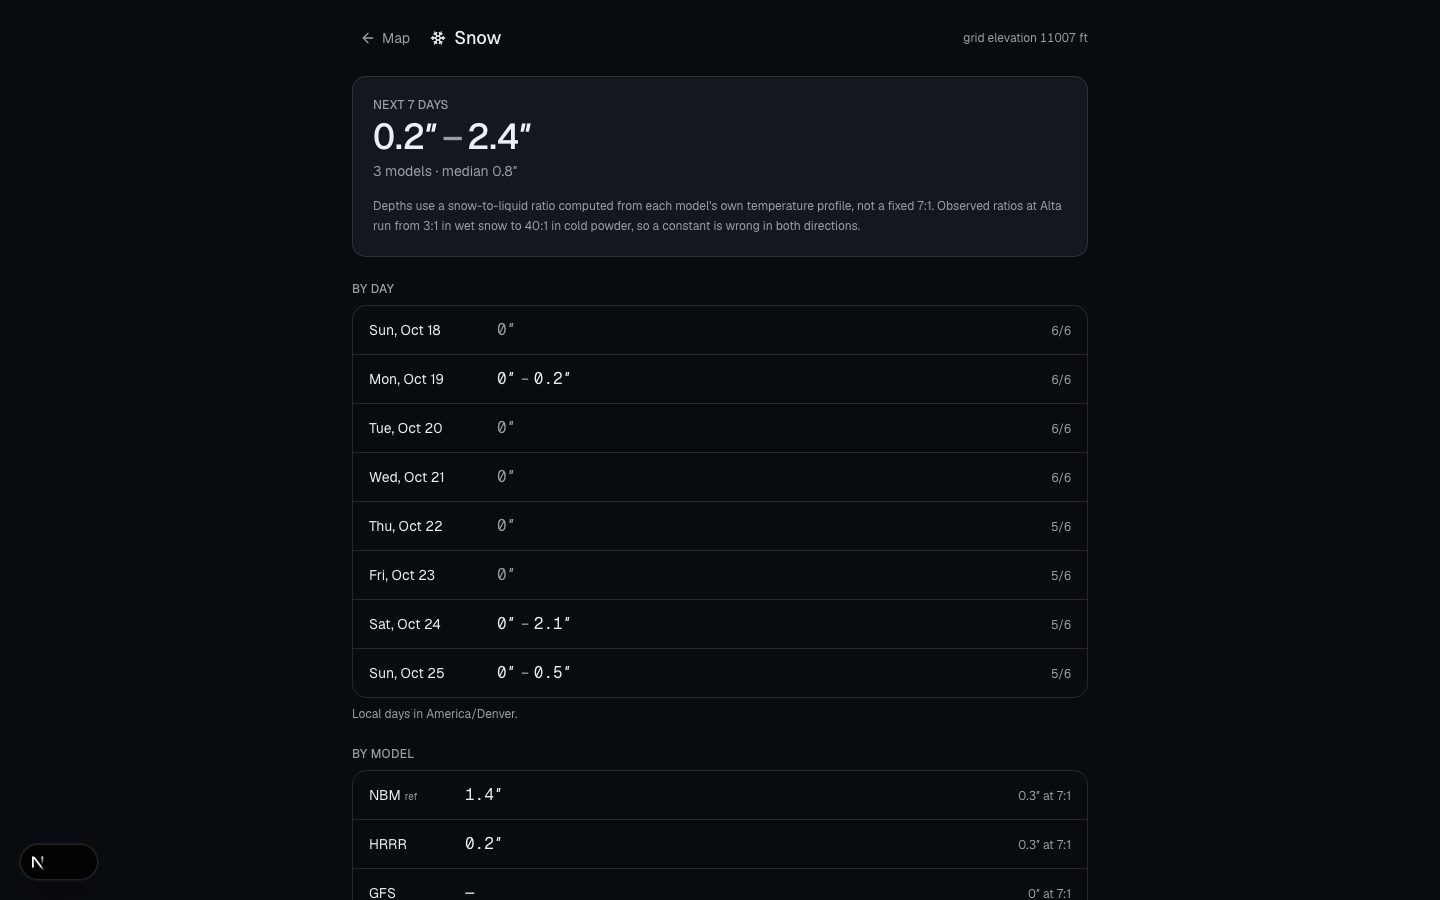
The wxdeck snow page for Vail with per-model snowfall and ratios
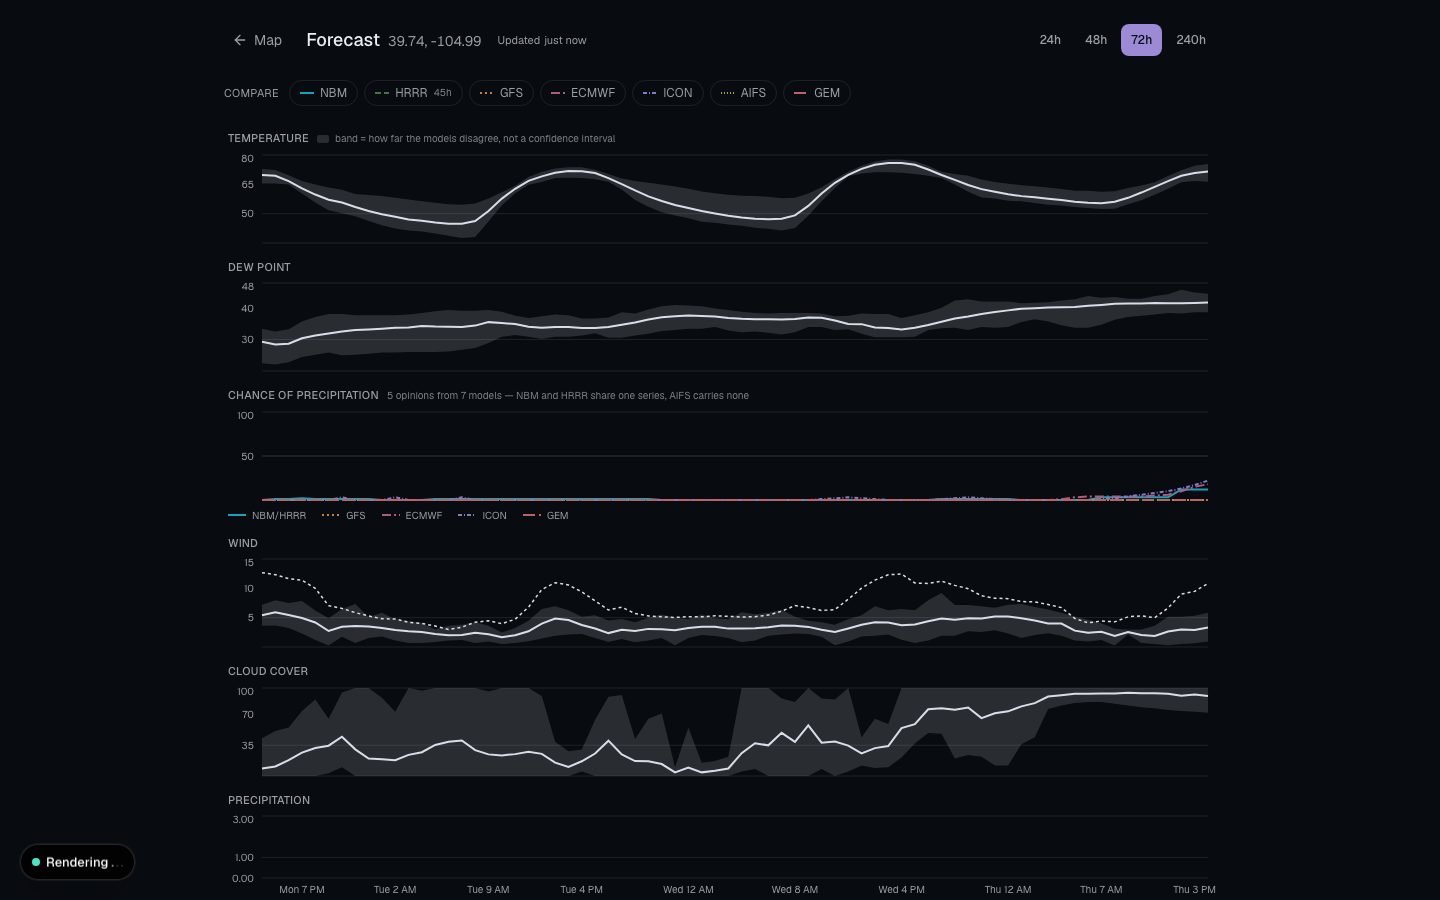
Multi-model meteogram for Denver with the spread band
Left: the snow forecast for Vail. Right: the Denver forecast, with each model drawn separately.

Pricing

wxdeck is free while it is in beta. When subscriptions open, the people who were here early will pay less. This is the shape of the plans; nothing is for sale yet.

Free

$0

Enough for checking the radar.

  • Live radar, with a couple of hours either side
  • Temperature and wind overlays
  • A forecast from three models
  • One saved place and one alert location

Pro

$49per year

Everything, for people who plan around the weather.

  • A full day of radar history and two days of forecast
  • All of the overlays, wind at altitude and isobars
  • Seven models, checked against what actually happened
  • The snow tools, powder alerts and ten alert locations

Teams

Ask

For people who need it for work.

  • Licensed for commercial use
  • Alerts by email or webhook
  • Forecasts and map tiles by API
  • A real person to talk to

Questions

More in the disclaimer.

Is this an official source?
No. The data comes from NOAA and the National Weather Service, but wxdeck is not connected to either. If safety is involved, go to weather.gov and your local authorities.
Where does the data come from?
Public sources: NOAA's radar and satellite feeds, the National Weather Service, and forecast models that government weather agencies publish openly. The full list is on the credits page.
What area is covered?
Radar covers the lower 48 states, with Alaska, Hawaii and Canada in progress. Forecasts cover North America. There is no radar for Europe or Asia.
How accurate is it?
As accurate as the models are. Rather than give one number, wxdeck shows several models at once so you can see when they agree and when they do not. Past forecasts are also checked against what happened, and the results are published.
Does it work on a phone?
Yes, in the browser. There is no app to install.
DataNOAA MRMSNOAA HRRRGOES-19 · NESDISNational Weather ServiceNational Hurricane CenterAWC & NDBCOpenFreeMap · OpenStreetMap